1. 写在前面
本问下面有矢量图层设置的区域,和热力图层设置的热力图的效果,区域绘制效怎么设置详细内容可以访问 openlayers6【十七】vue VectorLayer矢量图层画地图省市区,多省市区(粤港澳大湾区)效果详解,主要讲解的是热力图层效果实现。区域绘制只是为了效果更好看。好了,继续往下看
在 openlayers 中,图层是使用 layer 对象表示的,主要有 WebGLPoints Layer、热度图(HeatMap Layer)、图片图层(Image Layer)、切片图层(Tile Layer)和 矢量图层(Vector Layer)五种类型,它们都是继承 Layer 类的。
前面两篇文章 我们讲了矢量图层 VectorLayer的常用的场景,这篇我们写一篇 HeatMapLayer 的使用。可以看下图所示的热力图实现效果。 放大缩小地图热力图效果。
2. Heatmap 类实现热力图
2.1 Heatmap 参数
var heatmapLayer = new ol.layer.Heatmap({ source: source, opacity:1, visible:true, zIndex:1, gradient:['#00f','#0ff','#0f0','#ff0','#f00'], blur: 15, radius: 8, extent:[100,30,104,40], });
2.2 实现热力图
2.2.1 addHeatMap()方法详解:
-
准备热力图需要的初始化数据,colors 热图的颜色渐变,hatmapData 表示值数量越多显示到页面的热力图颜色越深。codeList 准备的数据的城市对应的经纬度坐标。
-
创建热力图图层
HeatmapLayer
-
把热力图图层添加到
map 中
-
调用添加热力图要素的方法
AppendFeatures()
2.2.2 addHeatMap()方法代码:
addHeatMap() { let colors = [ "#2200FF", "#16D9CC", "#4DEE12", "#E8D225", "#EF1616" ]; let hatmapData = [ { name: "成都市" }, { name: "成都市" }, { name: "成都市" }, { name: "成都市" }, { name: "绵阳市" }, { name: "广安市" }, { name: "雅安市" }, { name: "自贡市" }, { name: "自贡市" }, { name: "自贡市" }, { name: "自贡市" }, { name: "自贡市" }, { name: "自贡市" }, { name: "自贡市" }, { name: "宜宾市" }, { name: "甘孜藏族自治州市" } ]; let codeList = { 成都市: { center: { lng: 104.061902, lat: 30.609503 } }, 广安市: { center: { lng: 106.619126, lat: 30.474142 } }, 绵阳市: { center: { lng: 104.673612, lat: 31.492565 } }, 雅安市: { center: { lng: 103.031653, lat: 30.018895 } }, 自贡市: { center: { lng: 104.797794, lat: 29.368322 } }, 宜宾市: { center: { lng: 104.610964, lat: 28.781347 } }, 甘孜藏族自治州市: { center: { lng: 101.592433, lat: 30.426712 } } }; this.layer = new HeatmapLayer({ source: new VectorSource(), blur: 30, radius: 15, gradient: colors }); this.map.addLayer(this.layer); this.AppendFeatures(hatmapData, colors, codeList, 50); },
-
1
-
2
-
3
-
4
-
5
-
6
-
7
-
8
-
9
-
10
-
11
-
12
-
13
-
14
-
15
-
16
-
17
-
18
-
19
-
20
-
21
-
22
-
23
-
24
-
25
-
26
-
27
-
28
-
29
-
30
-
31
-
32
-
33
-
34
-
35
-
36
-
37
-
38
-
39
-
40
-
41
-
42
-
43
-
44
-
45
-
46
-
47
-
48
-
49
2.2.3 AppendFeatures()方法详解:
-
遍历hatmapData和points数据根据名称一致的 循环创建要素
new Feature点new Point信息
-
把要素添加到热力图层的数据源中
2.2.4 AppendFeatures()方法代码:
AppendFeatures(hatmapData, colors, points, max) { for (var i in hatmapData) { if (points[hatmapData[i].name]) { var coords = points[hatmapData[i].name]; this.max = max; var f = new Feature({ geometry: new Point( fromLonLat([coords.center.lng, coords.center.lat]) ) }); this.layer.getSource().addFeature(f); } } }
-
1
-
2
-
3
-
4
-
5
-
6
-
7
-
8
-
9
-
10
-
11
-
12
-
13
-
14
-
15
-
16
-
17
3. 完整代码
<template> <div id="app"> <div id="Map" ref="map"></div> </div> </template> <script> import "ol/ol.css"; import VectorLayer from "ol/layer/Vector"; import VectorSource from "ol/source/Vector"; import { Tile as TileLayer, Heatmap as HeatmapLayer } from "ol/layer"; import Proj from "ol/proj/Projection"; import XYZ from "ol/source/XYZ"; import { Map, View, Feature, ol } from "ol"; import { Style, Stroke, Fill } from "ol/style"; import { Polygon, Point } from "ol/geom"; import { defaults as defaultControls } from "ol/control"; import { fromLonLat } from "ol/proj"; import areaGeo from "@/geoJson/sichuan.json"; export default { data() { return { map: null }; }, methods: { initMap() { this.map = new Map({ target: "Map", controls: defaultControls({ zoom: true }).extend([]), layers: [ new TileLayer({ source: new XYZ({ url: "http://map.geoq.cn/ArcGIS/rest/services/ChinaOnlineStreetPurplishBlue/MapServer/tile/{z}/{y}/{x}" }) }) ], view: new View({ center: fromLonLat([104.065735, 30.659462]), zoom: 6.5, maxZoom: 19, minZoom: 5 }) }); }, addArea(geo = []) { if (geo.length == 0) { return false; } let features = []; geo.forEach(g => { let lineData = g.features[0]; let routeFeature = ""; if (lineData.geometry.type == "MultiPolygon") { routeFeature = new Feature({ geometry: new MultiPolygon( lineData.geometry.coordinates ).transform("EPSG:4326", "EPSG:3857") }); } else if (lineData.geometry.type == "Polygon") { routeFeature = new Feature({ geometry: new Polygon( lineData.geometry.coordinates ).transform("EPSG:4326", "EPSG:3857") }); } routeFeature.setStyle( new Style({ fill: new Fill({ color: "#4e98f444" }), stroke: new Stroke({ width: 3, color: [71, 137, 227, 1] }) }) ); features.push(routeFeature); }); let routeLayer = new VectorLayer({ source: new VectorSource({ features: features }) }); this.map.addLayer(routeLayer); }, addHeatMap() { let colors = [ "#2200FF", "#16D9CC", "#4DEE12", "#E8D225", "#EF1616" ]; let hatmapData = [ { name: "成都市" }, { name: "成都市" }, { name: "成都市" }, { name: "成都市" }, { name: "绵阳市" }, { name: "广安市" }, { name: "雅安市" }, { name: "自贡市" }, { name: "自贡市" }, { name: "自贡市" }, { name: "自贡市" }, { name: "自贡市" }, { name: "自贡市" }, { name: "自贡市" }, { name: "宜宾市" }, { name: "甘孜藏族自治州市" } ]; let codeList = { 成都市: { center: { lng: 104.061902, lat: 30.609503 } }, 广安市: { center: { lng: 106.619126, lat: 30.474142 } }, 绵阳市: { center: { lng: 104.673612, lat: 31.492565 } }, 雅安市: { center: { lng: 103.031653, lat: 30.018895 } }, 自贡市: { center: { lng: 104.797794, lat: 29.368322 } }, 宜宾市: { center: { lng: 104.610964, lat: 28.781347 } }, 甘孜藏族自治州市: { center: { lng: 101.592433, lat: 30.426712 } } }; this.layer = new HeatmapLayer({ source: new VectorSource(), blur: 30, radius: 15, gradient: colors }); this.map.addLayer(this.layer); this.AppendFeatures(hatmapData, colors, codeList, 50); }, AppendFeatures(hatmapData, colors, points, max) { for (var i in hatmapData) { if (points[hatmapData[i].name]) { var coords = points[hatmapData[i].name]; this.max = max; var f = new Feature({ geometry: new Point( fromLonLat([coords.center.lng, coords.center.lat]) ) }); this.layer.getSource().addFeature(f); } } } }, mounted() { this.initMap(); this.addArea(areaGeo); this.addHeatMap(); } }; </script> <style lang="scss" scoped> // 此处非核心内容,已删除 </style>
-
1
-
2
-
3
-
4
-
5
-
6
-
7
-
8
-
9
-
10
-
11
-
12
-
13
-
14
-
15
-
16
-
17
-
18
-
19
-
20
-
21
-
22
-
23
-
24
-
25
-
26
-
27
-
28
-
29
-
30
-
31
-
32
-
33
-
34
-
35
-
36
-
37
-
38
-
39
-
40
-
41
-
42
-
43
-
44
-
45
-
46
-
47
-
48
-
49
-
50
-
51
-
52
-
53
-
54
-
55
-
56
-
57
-
58
-
59
-
60
-
61
-
62
-
63
-
64
-
65
-
66
-
67
-
68
-
69
-
70
-
71
-
72
-
73
-
74
-
75
-
76
-
77
-
78
-
79
-
80
-
81
-
82
-
83
-
84
-
85
-
86
-
87
-
88
-
89
-
90
-
91
-
92
-
93
-
94
-
95
-
96
-
97
-
98
-
99
-
100
-
101
-
102
-
103
-
104
-
105
-
106
-
107
-
108
-
109
-
110
-
111
-
112
-
113
-
114
-
115
-
116
-
117
-
118
-
119
-
120
-
121
-
122
-
123
-
124
-
125
-
126
-
127
-
128
-
129
-
130
-
131
-
132
-
133
-
134
-
135
-
136
-
137
-
138
-
139
-
140
-
141
-
142
-
143
-
144
-
145
-
146
-
147
-
148
-
149
-
150
-
151
-
152
-
153
-
154
-
155
-
156
-
157
-
158
-
159
-
160
-
161
-
162
-
163
-
164
-
165
-
166
-
167
-
168
-
169
-
170
-
171
-
172
-
173
-
174
-
175
-
176
-
177
4. 添加删除map图层的方法
this.map.addLayer(this.layer) this.map.removeLayer(this.layer)
5. 热力图自身的get,set方法
heatmapLayer.getBlur() heatmapLayer.setBlur(15) heatmapLayer.getExtent() heatmapLayer.setExtent([100,30,104,40]) heatmapLayer.getGradient() heatmapLayer.setGradient(['#00f','#0ff','#0f0','#ff0','#f00']) heatmapLayer.getMaxZoom() heatmapLayer.setMaxZoom(18) heatmapLayer.getMinZoom() heatmapLayer.setMinZoom(2) heatmapLayer.getOpacity() heatmapLayer.setOpacity(0.5) heatmapLayer.getRadius() heatmapLayer.setRadius(5) heatmapLayer.getSource() heatmapLayer.setSource(source) heatmapLayer.getVisible() heatmapLayer.setVisible(true) heatmapLayer.getZIndex() heatmapLayer.setZIndex(2) heatmapLayer.on(type,listener) heatmapLayer.un(type,listener)
            蓝蓝设计建立了UI设计分享群,每天会分享国内外的一些优秀设计,如果有兴趣的话,可以进入一起成长学习,请扫码蓝小助,报下信息,蓝小助会请您入群。欢迎您加入噢~~希望得到建议咨询、商务合作,也请与我们联系。


            部分借鉴自:csdn


            分享此文一切功德,皆悉回向给文章原作者及众读者.


            免责声明:蓝蓝设计尊重原作者,文章的版权归原作者。如涉及版权问题,请及时与我们取得联系,我们立即更正或删除。


            蓝蓝设计( www.lanlanwork.com )是一家专注而深入的界面设计公司,为期望卓越的国内外企业提供卓越的UI界面设计、BS界面设计 、 cs界面设计 、 ipad界面设计 、 包装设计 、 图标定制 、 用户体验 、交互设计、 网站建设 、平面设计服务


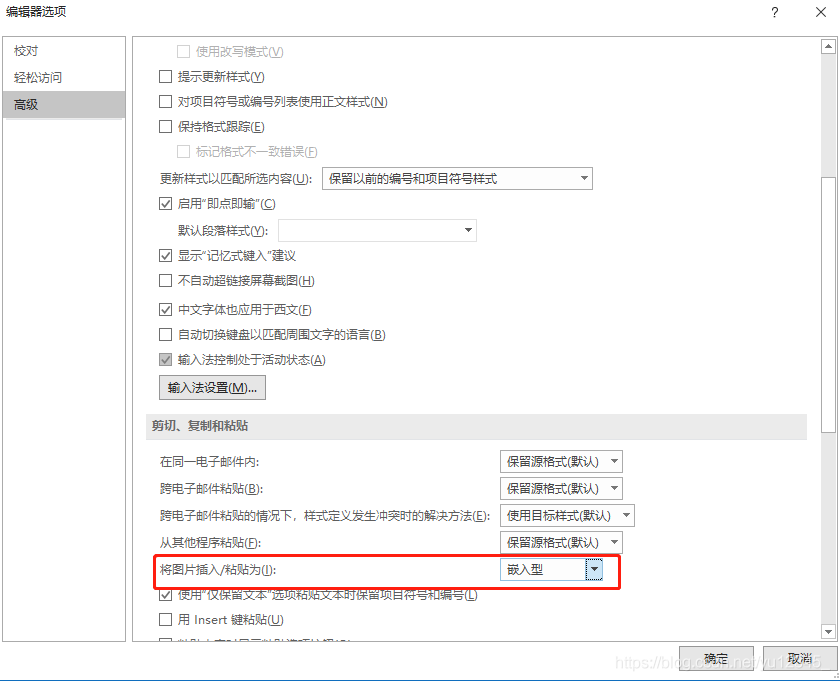 这种方法的限制很多,比如你将图片插入修改为“四周紧密型”,那么你插入的图片在编辑器中看不到,实际使用的时候是可以看见的。这就很别扭了,还有就是图片好像会成为附件,如果有你的照片你不想别人每次下载附件将你的照片下载过去吧·······